Classification Models - Logistic Regression
Description
Logistic Regression is a machine learning classification model used to predict the probability of a binary outcome. It is a type of supervised learning algorithm that works well with large datasets.
The model calculates the odds of the target variable belonging to a specific class. It applies the logistic function, or sigmoid function, to map the output to a value between 0 and 1, representing the probability of the data point belonging to a certain class.
Logistic Regression assumes the relationship between the input variables and the output is linear. It makes use of numerical optimization techniques to estimate the parameters, including maximum likelihood estimation.
The model’s decision boundary can be adjusted, allowing for different classification thresholds. It is commonly used for binary classification tasks, such as predicting whether an email is spam or not, or whether a loan applicant will default or not.
Overall, Logistic Regression is a versatile and widely used classification model due to its simplicity and interpretability.
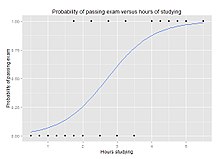
Image source: Wikipedia
History
Logistic regression is a statistical approach used to model the relationship between a dependent variable and one or more independent variables. It is a classic algorithm for solving binary classification problems, also applicable to multiclass scenarios. Utilizing the logistic function, it estimates the probability of an instance belonging to a specific class. Introduced in the late 19th century by statistician David Cox, logistic regression gained popularity due to its simplicity and interpretability. Over time, it has been extensively used in various fields, becoming a fundamental technique in machine learning classification models.
Use Cases
- Email spam detection: Logistic regression can be used to classify emails as spam or not spam based on various features such as keywords, email sender, and email content.
- Disease diagnosis: Logistic regression can be implemented to predict whether a patient has a certain disease or not based on their medical history, symptoms, lab results, and other relevant information.
- Credit risk assessment: Logistic regression can help evaluate the creditworthiness of individuals by assessing various factors like income, credit score, employment status, and loan repayment history.
- Customer churn prediction: Logistic regression can be used to forecast the likelihood of a customer leaving a particular service or subscription based on their usage patterns, feedback, and engagement history.
- Image classification: Logistic regression can be applied to classify images into multiple categories, such as medical imaging for identifying different types of diseases, object recognition in autonomous vehicles, or facial expression recognition.
- Sentiment analysis: Logistic regression can be utilized to determine the sentiment of text data, such as identifying whether a movie review or social media post is positive, negative, or neutral.
- Fraud detection: Logistic regression can be employed to identify fraudulent transactions or activities based on features like transaction amount, location, time, and user behavior patterns.
- Market segmentation: Logistic regression can assist in dividing a market into distinct segments based on various demographic, behavioral, or psychographic factors to target specific customer groups efficiently.
Pros
- Interpretability: Logistic Regression provides a straightforward interpretation of results, making it easier to understand and explain the impact of each feature on the classification outcome.
- Efficiency: It is computationally efficient, especially when dealing with a large number of features or a large dataset, which makes it suitable for real-time and online learning scenarios.
- No assumptions of linearity: Unlike some other classification models, Logistic Regression does not assume a linear relationship between features and the log-odds of the outcome. It can capture complex relationships with appropriate feature engineering.
- Probability estimation: Logistic Regression provides probability estimates rather than just binary predictions. This is beneficial when a probabilistic interpretation is required, allowing for better decision-making based on confidence levels.
- Regularization: Regularization techniques such as L1 or L2 regularization can be applied to Logistic Regression, which helps prevent overfitting by adding a penalty to overly complex models.
Cons
- Assumption of linearity: Logistic regression assumes that the relationship between the independent variables and the log-odds of the dependent variable is linear. If the relationship is not linear, the model may not provide accurate predictions.
- Highly influenced by outliers: Logistic regression is sensitive to outliers, which are extreme values that significantly differ from other samples in the dataset. Outliers can strongly influence the estimated coefficients and affect the model's performance.
- Unsuitable for non-linear relationships: Logistic regression cannot capture complex non-linear relationships between the independent variables and the dependent variable, as it assumes a linear relationship. When dealing with nonlinear data, other models might be more appropriate.
- Overfitting: Logistic regression models with a large number of features or variables are prone to overfitting, which means the model becomes too complex and learns noise or irrelevant patterns from the training data. Overfitting leads to poor generalization and reduces the model's predictive accuracy on new data.
- Irrelevant features: If irrelevant features are included in the logistic regression model, they may introduce noise and decrease the model's performance. Feature selection techniques should be applied to ensure only meaningful and relevant features are used in model training.
Hyper parameters
- Penalty: Determines the type of regularization used, such as L1 or L2 regularization.
- C: Controls the inverse of the regularization strength, with smaller values indicating stronger regularization.
- Fit Intercept: Specifies whether to calculate the intercept for the model or not.
- Class Weight: Assigns weights to classes to handle class imbalance or misclassification costs.
- Solver: Determines the algorithm to be used for optimization, like 'newton-cg', 'lbfgs', 'liblinear', or 'sag'.
- Max Iterations: Sets the maximum number of iterations for the solver to converge.
- Multi Class: Specifies the strategy for handling multi-class classification problems.
- Random State: Defines the seed value for random number generation.
- Verbose: Controls the verbosity level while fitting the model.
- Warm Start: Allows reusing the existing fitted coefficients when fitting the model again.
Pitfalls
- Overfitting: Logistic regression can be prone to overfitting when there are too many predictors or when these predictors are highly correlated.
- Underfitting: On the other hand, logistic regression may also underfit when the model is too simple to capture the underlying relationships in the data.
- Assumption of linearity: Logistic regression assumes a linear relationship between the predictors and the log-odds of the response variable. Violation of this assumption can lead to flawed predictions.
- Missing data: If the dataset contains missing values, logistic regression may struggle to handle them appropriately. Missing data imputation techniques may be required.
- Multicollinearity: Logistic regression can be sensitive to multicollinearity, where two or more predictors are highly correlated. This can impact the interpretation and stability of the model coefficients.
- Imbalanced classes: Logistic regression may not perform well when the classes in the response variable are imbalanced. Techniques such as oversampling or undersampling may be necessary to address this issue.
- Outliers: Outliers in the data can have a significant impact on the logistic regression model. It is important to detect and handle outliers appropriately to avoid biased results.
- Non-independent observations: Logistic regression assumes that the observations are independent of each other. If there is a violation of this assumption, such as in time series data or clustered data, additional techniques may be required.
- Lack of interpretability: While logistic regression provides insights into the relationship between predictors and the response, it may not capture complex interactions or non-linear patterns present in the data.
Algorithm behind the scenes
Sure! In logistic regression, we aim to build a classification model that predicts the probability of a binary outcome. This algorithm is widely used in machine learning for classification tasks. Logistic regression works by fitting a logistic function to the data. The logistic function (also known as the sigmoid function) takes any real-valued number and maps it into the range [0, 1]. This allows us to interpret the output as a probability. The logistic regression algorithm involves several steps. Let's break them down into paragraphs:Step 1: Data Preparation
First, we need to prepare our data. We typically represent our training data as a matrix X, where each row represents a training example and each column represents a feature. We also have a vector y that contains the corresponding binary labels (0 or 1) for each training example.Step 2: Model Representation
The logistic regression model is represented by the following equation:Step 3: Hypothesis Function
The hypothesis function hθ(x) represents the predicted probability that y = 1 for a given input x. It computes the dot product of the parameter vector θ and the feature vector x. This dot product is passed through the logistic function to produce the predicted probability.Step 4: Cost Function
To train our logistic regression model, we need to define a cost function that measures the error between the predicted probabilities and the true labels. The cost function for logistic regression is typically defined as the log loss (or cross-entropy loss) function:Step 5: Learning Algorithm
To find the optimal values of the parameter vector θ, we need to minimize the cost function J(θ). This can be done using optimization algorithms like gradient descent, where we iteratively update the weights θ to minimize the cost.Step 6: Gradient Descent
Gradient descent is an iterative optimization algorithm used to find the minimum of a function. In logistic regression, it updates the parameter vector θ using the following equation:Python Libraries
Code
Sure! Here are some Python code samples using the Logistic Regression algorithm for classification models using popular Python libraries:

1. scikit-learn:
```python
from sklearn.linear_model import LogisticRegression

# Load your dataset
X, y = load_dataset()

# Create a Logistic Regression classifier
classifier = LogisticRegression()

# Fit the classifier to the data
classifier.fit(X, y)

# Make predictions
predictions = classifier.predict(X_test)
```

2. TensorFlow:
```python
import tensorflow as tf
from tensorflow.keras.models import Sequential
from tensorflow.keras.layers import Dense

# Load your dataset
X, y = load_dataset()

# Create a Logistic Regression model using TensorFlow
model = Sequential()
model.add(Dense(units=1, activation='sigmoid', input_dim=X.shape[1]))

# Compile the model
model.compile(optimizer='sgd', loss='binary_crossentropy', metrics=['accuracy'])

# Fit the model to the data
model.fit(X, y, epochs=100)

# Make predictions
predictions = model.predict_classes(X_test)
```

3. PyTorch:
```python
import torch
import torch.nn as nn
import torch.optim as optim

# Load your dataset
X, y = load_dataset()

# Define a Logistic Regression model using PyTorch
class LogisticRegression(nn.Module):
    def __init__(self):
        super(LogisticRegression, self).__init__()
        self.linear = nn.Linear(X.shape[1], 1)
        self.sigmoid = nn.Sigmoid()

    def forward(self, x):
        output = self.linear(x)
        output = self.sigmoid(output)
        return output

model = LogisticRegression()

# Define the loss function and optimizer
criterion = nn.BCELoss()
optimizer = optim.SGD(model.parameters(), lr=0.01)

# Train the model
for epoch in range(100):
    optimizer.zero_grad()
    output = model(X)
    loss = criterion(output, y)
    loss.backward()
    optimizer.step()

# Make predictions
predictions = (model(X_test) > 0.5).float()
```

These code samples demonstrate the implementation of Logistic Regression using scikit-learn, TensorFlow, and PyTorch, which are popular Python libraries for machine learning. Remember to replace `load_dataset()` with your own code or appropriate function to load your dataset.